Introduction
What if the federal minimum wage is raised to 16 dollars an hour?
What if Steve Smith bats at number 5 in the Ashes 2019 instead of number 3?
What if Australian style gun laws were implemented in the USA - what would be the impact on gun related violence?
What if Eden Hazard attacks today instead of winging in the midfield?
What if Steve Smith bats at number 5 in the Ashes 2019 instead of number 3?
What if Australian style gun laws were implemented in the USA - what would be the impact on gun related violence?
What if Eden Hazard attacks today instead of winging in the midfield?
"What if?” is one of the favorite questions that occupy minds, from sports fans to policymakers to philosophers. Invariably, there is no one answer to the What ifs and everyone remains convinced in their own alternate realities but a new wave of work has been looking at data-driven approaches to answer (at least a subset of) these What If questions. The mathematical tool of (Robust) Synthetic Control examines these What If questions by creating a synthetic version of reality and explore its evolution in time as a counterfactual to the actual reality.
Recently, together with my collaborators Jehangir Amjad (MIT/Google) Devavrat Shah (MIT) and Dennis Shen (MIT), we proposed a generalization of Robust Synthetic Control, the multi-dimensional Robust Synthetic Control (mRSC), and also demonstrated how the technique can be used to do time series predictions. The paper is appearing at the 2019 Joint Sigmetrics/Performance conference.
As a fun application of the idea, we show how we can predict cricket scores accurately. We utilize the twin metrics of runs and wickets and cast it as an mRSC problem that enables us to predict the evolution of an innings with very little data. While we will continue to endlessly speculate What if Kumble had continued as the coach rather than Shastri, in this post we describe a mathematical tool that lets us predict the end of innings score after only a few overs!
Counterfactuals and Synthetic Control
When evaluating the impact of a policy (e.g., gun control) on a metric of interest (e.g., crime-rate), it may not be possible or feasible to conduct a randomized control trial. In an ideal scenario, we would want two copies of reality, one with the policy and one without, and if there is a difference in the metric of interest in the two versions of reality we say that the policy had an impact. Given that we haven't conclusively shown the existence of multiverses, much less access them - what does one do? The problem statement is how does one estimate the counterfactual, i.e. simulate that other reality and measure that metric based only on observations of the one reality we have? A brilliant way to solve that problem was proposed by Abadie et al. called Synthetic Control. The idea behind the technique is simple: assume that the change in policy happens in one clearly identified region (this change is called an intervention and the region is called the treatment unit) and several other regions exist which are correlated behaviorally to that region (but are not identical) which do not have that policy implemented and are called the donor pool (or placebos). An example is the policy of Proposition 99 implemented in 1988 in California, which levied a tax of 25 cents per pack of cigarettes. This additional tax not only made cigarettes more expensive to buy but the revenue raised by the tax was used to implement anti-tobacco programs throughout the state to raise awareness on the harms of tobacco and fund tobacco research. These twin effects were believed to have had a significant impact on cigarette consumption and the sales indeed went down, but how does one evaluate precisely if the tax had an impact or society had started frowning on smoking anyway because nationwide the sales were down? The insight was that California's behavior was indeed correlated to that of the other 49 states (more correlated with New York and Massachusetts than say Arizona or Texas), and one can construct a synthetic version of California using the other 49 states. More precisely, the time series of cigarette sales in California pre-Prop 99 was approximated as a linear combination of the sale of cigarettes in the other 49 states, where the weight of each state was determined by a regression process. The result of the analysis was striking and is shown in Figure 1: while cigarette sales did go down nationally and so also in the synthetic California, the real California had a much faster decrease in cigarette sales due to Proposition 99.
 |
| Figure 1. Impact of Proposition 99 on Cigarette Sales in California |
Robust Synthetic Control (and Cricket)
While the idea of Synthetic Control was brilliant and found a lot of success in estimating counterfactuals, it was also in some cases fragile and not robust to missing or noisy data. My collaborators at MIT developed a powerful latent variable model for Synthetic Control, and made it robust against noisy and missing data. The key idea was that any observation is the sum of a function of two latent (i.e. hidden) variables and an independent noise term. The two latent variables are indexed by the donor pool, and time respectively. Then the entire dataset can be represented in a matrix where the rows correspond to the treatment unit and the donor pool units, and the y-axis corresponds to the time. The data-driven technique doesn't actually care what the variables are, or even what the nature of the function is, but is able to build an accurate model of the system based on the observations. That work formed the core of Jehangir's Ph.D. thesis. Jehangir is a cricket nut like me and his advisor Devavrat is my friend and we always wanted to work together but hadn't executed on that yet. Independently Devavrat had promised Jehangir that they would do at least one cricket related piece of work together. So Devavrat put 2 and 2 (or 11 and 11..) together, and called me one day with a proposal to work on a problem related to the biased behavior of the Duckworth-Lewis-Stern (DLS) method, a statistical system to account for the impact of rain interruptions in a cricket match. I had heard of the Synthetic Control method thanks to my wife who is a data scientist at FDNY but had no idea that Jehangir, Devavrat and Dennis had developed the Robust Synthetic Control method. So in my naïveté, I asked Devavrat "Have you heard of Synthetic Control? That might be the right tool for this problem". I don't know how hard Devavrat laughed when he saw my email, but here is his polite response to me:

So we embarked on working together to build a model for cricket based on Robust Synthetic Control. Our metric of interest was the trajectory of runs scored by a team, with the "time" axis being the (sequential) ball of the game. The donor pool consisted of all the past ODI games that had happened thus far, and we devised a way to build a "synthetic" version of a game which had an intervention (rain-related interruption) based on the past games in the donor pool. Quickly we realized that looking only at the runs trajectory was not enough, we also needed to consider the wickets lost (a different metric, but is important for the evolution of the score metric) and initially we improved the model by filtering the donor pool to be of innings where the number of wickets lost was within +- one of the innings in question at the intervention point. However, we quickly converged to an even better way....
mRSC: multidimensional Robust Synthetic Control
A fundamental issue (in our opinion) of the DLS system is that it is "Markovian", i.e. it only looks at what the current score is and doesn't account for how you reached the current score. So if you are 191/4, DLS would treat it the same if you were 22/3 and recovered to 191/4 or if you were 171/0 and collapsed to 191/4. Cricket, as with any other sport, is very momentum driven. The trajectory of the wicket losses has an important impact on the trajectory of the runs scored. So we realized that additional metrics are also useful in building the model of the system. Hence we changed our representation of the observation as a function of three (latent) variables - one corresponding to the treatment or donor unit, one corresponding to the "time", and finally one corresponding to the measured metric; plus the independent noise term. The model then moved from a matrix to a third-order tensor. We showed that Robust Synthetic Control then becomes a special case of mRSC (when the number of metrics considered is 1). The details are in the paper and are not crucial to understand the concept so I won't present them here. The critical point is that by fusing together multiple related metrics, we are able to build a much more accurate representation of the system, requiring a much shorter dataset pre-intervention.
Validating the technique and time series prediction
Once we have the formulation and built the model, a natural question is how does one validate the model? Recall that the original application was to estimate counterfactuals and for that one needs to not only identify specific interventions but know the exact impact of them and compare that against the multi-dimensional synthetic model that we built. Although it is possible to use the pre-intervention data to cross-validate the performance of any estimation method, such a methodology ignores the period of interest: the post-intervention period. An alternate and more effective approach is to study the performance of an estimation method on units that do not experience the intervention, i.e., the placebo units. If the method is able to accurately estimate the observed post-intervention evolution of the placebo unit(s), it would be reasonable to assume that it would perform well in estimating the unobserved counterfactuals for the unit of interest. So we performed extensive validation of the technique by comparing the evolution of metrics of interest for a variety of "placebo" units in various settings, and in the process developed a general purpose time series prediction algorithm. As long as the notion of time is relative, i,e, the donor pool has already undergone the future evolution in "time", our synthetic model will be able to predict the future evolution of the unit of interest. Examples of such scenarios are sporting contests, where the "time" is say balls of a game or minute of a contest and the donor pool consists of historical games, or the financial projections of revenues of a company where the "time" axis is month of the year or quarter, and donor pool consists of the corresponding periods in prior years. It can also be used to predict things like traffic on a site, where you have daily data for prior years (including spikes generated by periodic events like holidays etc.). One could predict the traffic generated in a datacenter by the regular launch of computational tasks like map reduce jobs etc. In short, any scenario where there is some repeating (but not exact) pattern, our technique can build a model of the current system by incorporating information of past instances of the same pattern. Some examples of our scheme in action are below, you can find more details in the paper:
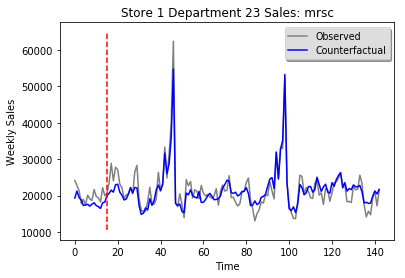
Figure 2: Predicting sales in a department of a Walmart store. Multiple metrics are sales in different departments, donor pool is data from other stores. Red line is time at which prediction is made

Figure 4: Final score of the innings in an Aus-Zim ODI in 2004. Multiple metrics are wickets and runs, the donor pool is historical ODIs. Prediction made at 30th over.

Figure 5: Final score of a team in an NBA game. Multiple metrics are the score trajectories of team 1 and score trajectories of team 2 (other team). Donor pool is past NBA games. Score updated ever 15 seconds, prediction made at the end of 1st quarter.
Code and examples
As I have tried to explain, our technique is a very general purpose one applicable to a variety of scenarios for both counterfactual estimations as well as time series prediction. If this interests you and you want to try it out, Jehangir has made his code available on github. Please feel free to download and play around with it. I began the post with a few counterfactuals that we can imagine estimating with the technique, and I'll bookend it with some example of time series predictions one can do:
I have sales data for my company for the past several years. Based on the first three months of sales, what do the projections for the rest of the year look like?
CSK is 76/3 at the end of 9 overs. What is going to be their end of innings score?
The traffic on my network is growing. I have data from the first few months of the year - what kind of capacity planning I need to do to accommodate growth by the end of the year?
Golden State is leading against the Bucks 28-26 at the end of the 1st quarter. Who is going to win and what would be the score?
Very interesting and easy read.
ReplyDeleteIT is very eaiest content, about python, i think.
ReplyDeletepython course london
Thank you for nice post. If you are a telenor user then you can win free mbs everyday. All you have to use the Telenor test my skills section from the telenor application and put right answers. For latest updated answer you can refer to today telenor quiz answer
ReplyDeleteI used to be just searching along with and arrived on your website. just required to say great Web page which info truly served me.สล็อตออนไลน์
ReplyDeleteI used to be just searching along with and arrived on your website. just required to say great Web page which info truly served me.สล็อต 999
ReplyDeleteWow, This really is de facto pleasing learning. I am happy I identified this and purchased to study it. Exceptional task on this articles substance. I like it.สล็อตวอเลท
ReplyDeleteGreat stuff you have acquired obtained and you retain update all of us.สล็อตแตกง่าย
ReplyDeleteIt is actually a wonderful put up – large very crystal clear and straightforward to grasp. I'm also Keeping out While using the sharks at the same time that created me giggle.บา คา ร่า วอ เลท
ReplyDeleteJust about every minor thing has its price. Thanks for sharing this enlightening facts with us. Exceptional operates!บา คา ร่า วอ เลท
ReplyDeleteYou realize your Positions jump out with the gang. There exists another thing Particular about them. It appears to me most of these are brilliant.สล็อตเว็บใหญ่
ReplyDeleteThis is commonly this kind of a wonderful source you happen to be furnishing and Additionally you give it absent without charge. I love viewing blog web-site that realize the value of furnishing a top good quality useful resource free of charge.บา คา ร่า วอ เลท
ReplyDeleteI needed to thanks for this great go through via!! I unquestionably using pleasure in Every minimum minimal little bit of it I Have you ever ever bookmarked to Check out new things you article.สล็อต ฝาก-ถอน true wallet ไม่มี บัญชีธนาคาร
ReplyDeleteThis comment has been removed by the author.
ReplyDeleteA lot of thanks for a very interesting Internet site. What else could Potentially I get that kind of information revealed in these a great Option? I’ve a undertaking that i'm simply just just now working on, And that i are literally within the watch out for this kind of specifics.บาคาร่าวอเลท
ReplyDeleteAn especially magnificent site internet site posting. We have been really grateful for your blog site site publish. You will see lots of strategies right away soon after browsing your set up.สล็อตทรูวอเลท
ReplyDeleteHey what an outstanding place up I have face and believe in me I are now browsing out for this equal form of publish for prior each week and scarcely stumbled on this. Many thanks very much and should look For additional postings from you.สล็อตแตกง่าย
ReplyDeleteThanks For sharing this Fantastic short article.I reap the benefits of this shorter write-up to point out my assignment in class.it is helpful For me Wonderful Function.สล็อตxo
ReplyDeleteLike to examine it,Waiting for Considerably more new Update Which i By now Analyze your New Write-up its Good Lots of thanks.เว็บสล็อต
ReplyDeleteWow I am able to say That is yet another fantastic write-up as envisioned of this weblog.Bookmarked This great web page..เว็บสล็อตเว็บตรง
ReplyDeleteThis comment has been removed by the author.
ReplyDeleteMany thanks for sharing the publish.. mom and father are worlds finest human being in Every single particular person lives of person..they want or ought to triumph to sustain requires in the kin.เว็บตรงสล็อต
ReplyDeleteMany thanks for sharing us.เว็บ ตรง
ReplyDeleteOutstanding and really thrilling web site. Appreciate to look at. Preserve Rocking.เกมสล็อต
ReplyDeleteSuperb post. Unbelievably interesting to look at. I in fact love to examine through this kind of great publish-up. Many thanks! keep rocking.สล็อต เว็บ ตรง
ReplyDelete